Benchmark Results - Problem U3
I. Problem Description
A. Overall Approach
Vectors are drawn from a uniform distribution over \([0, 1]^d\) and then exponentially scaled to range \([0.1, 10]^d\)
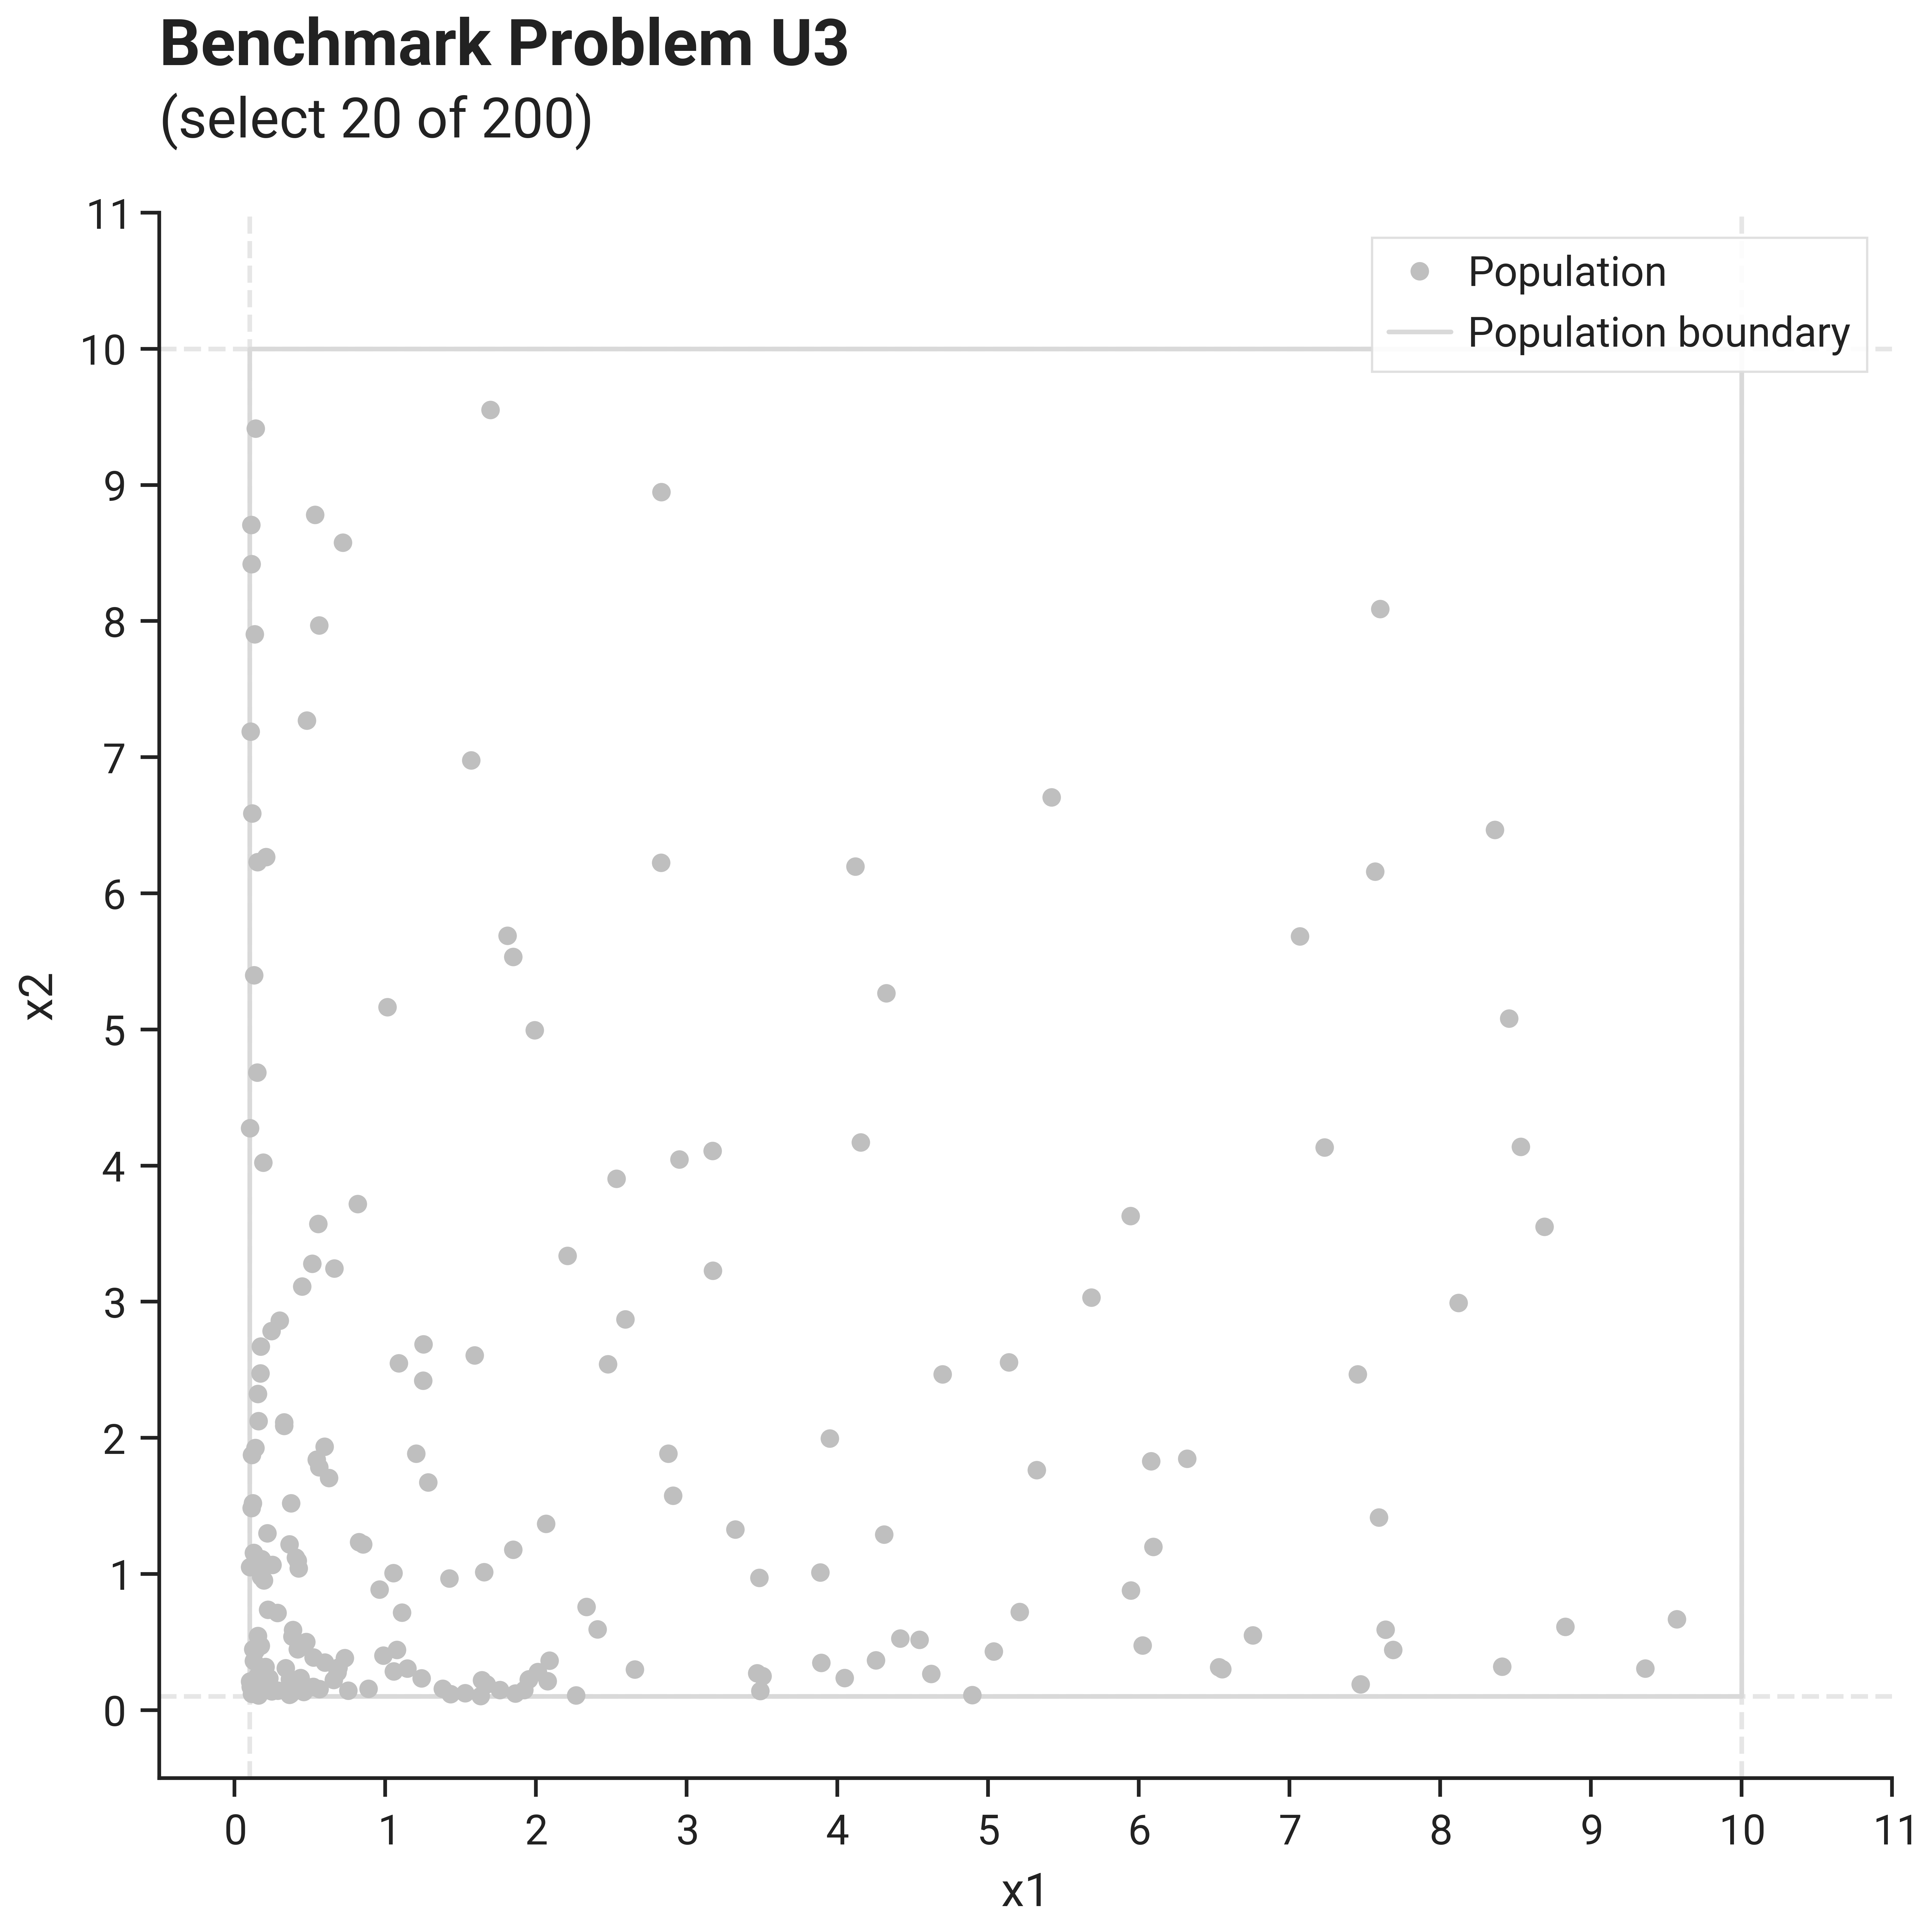
B. Visualization
This image shows problem U3 with size parameter \(s=2\) (thus \(d=2\), \(n=200\), \(k=20\), \(m=0\)):
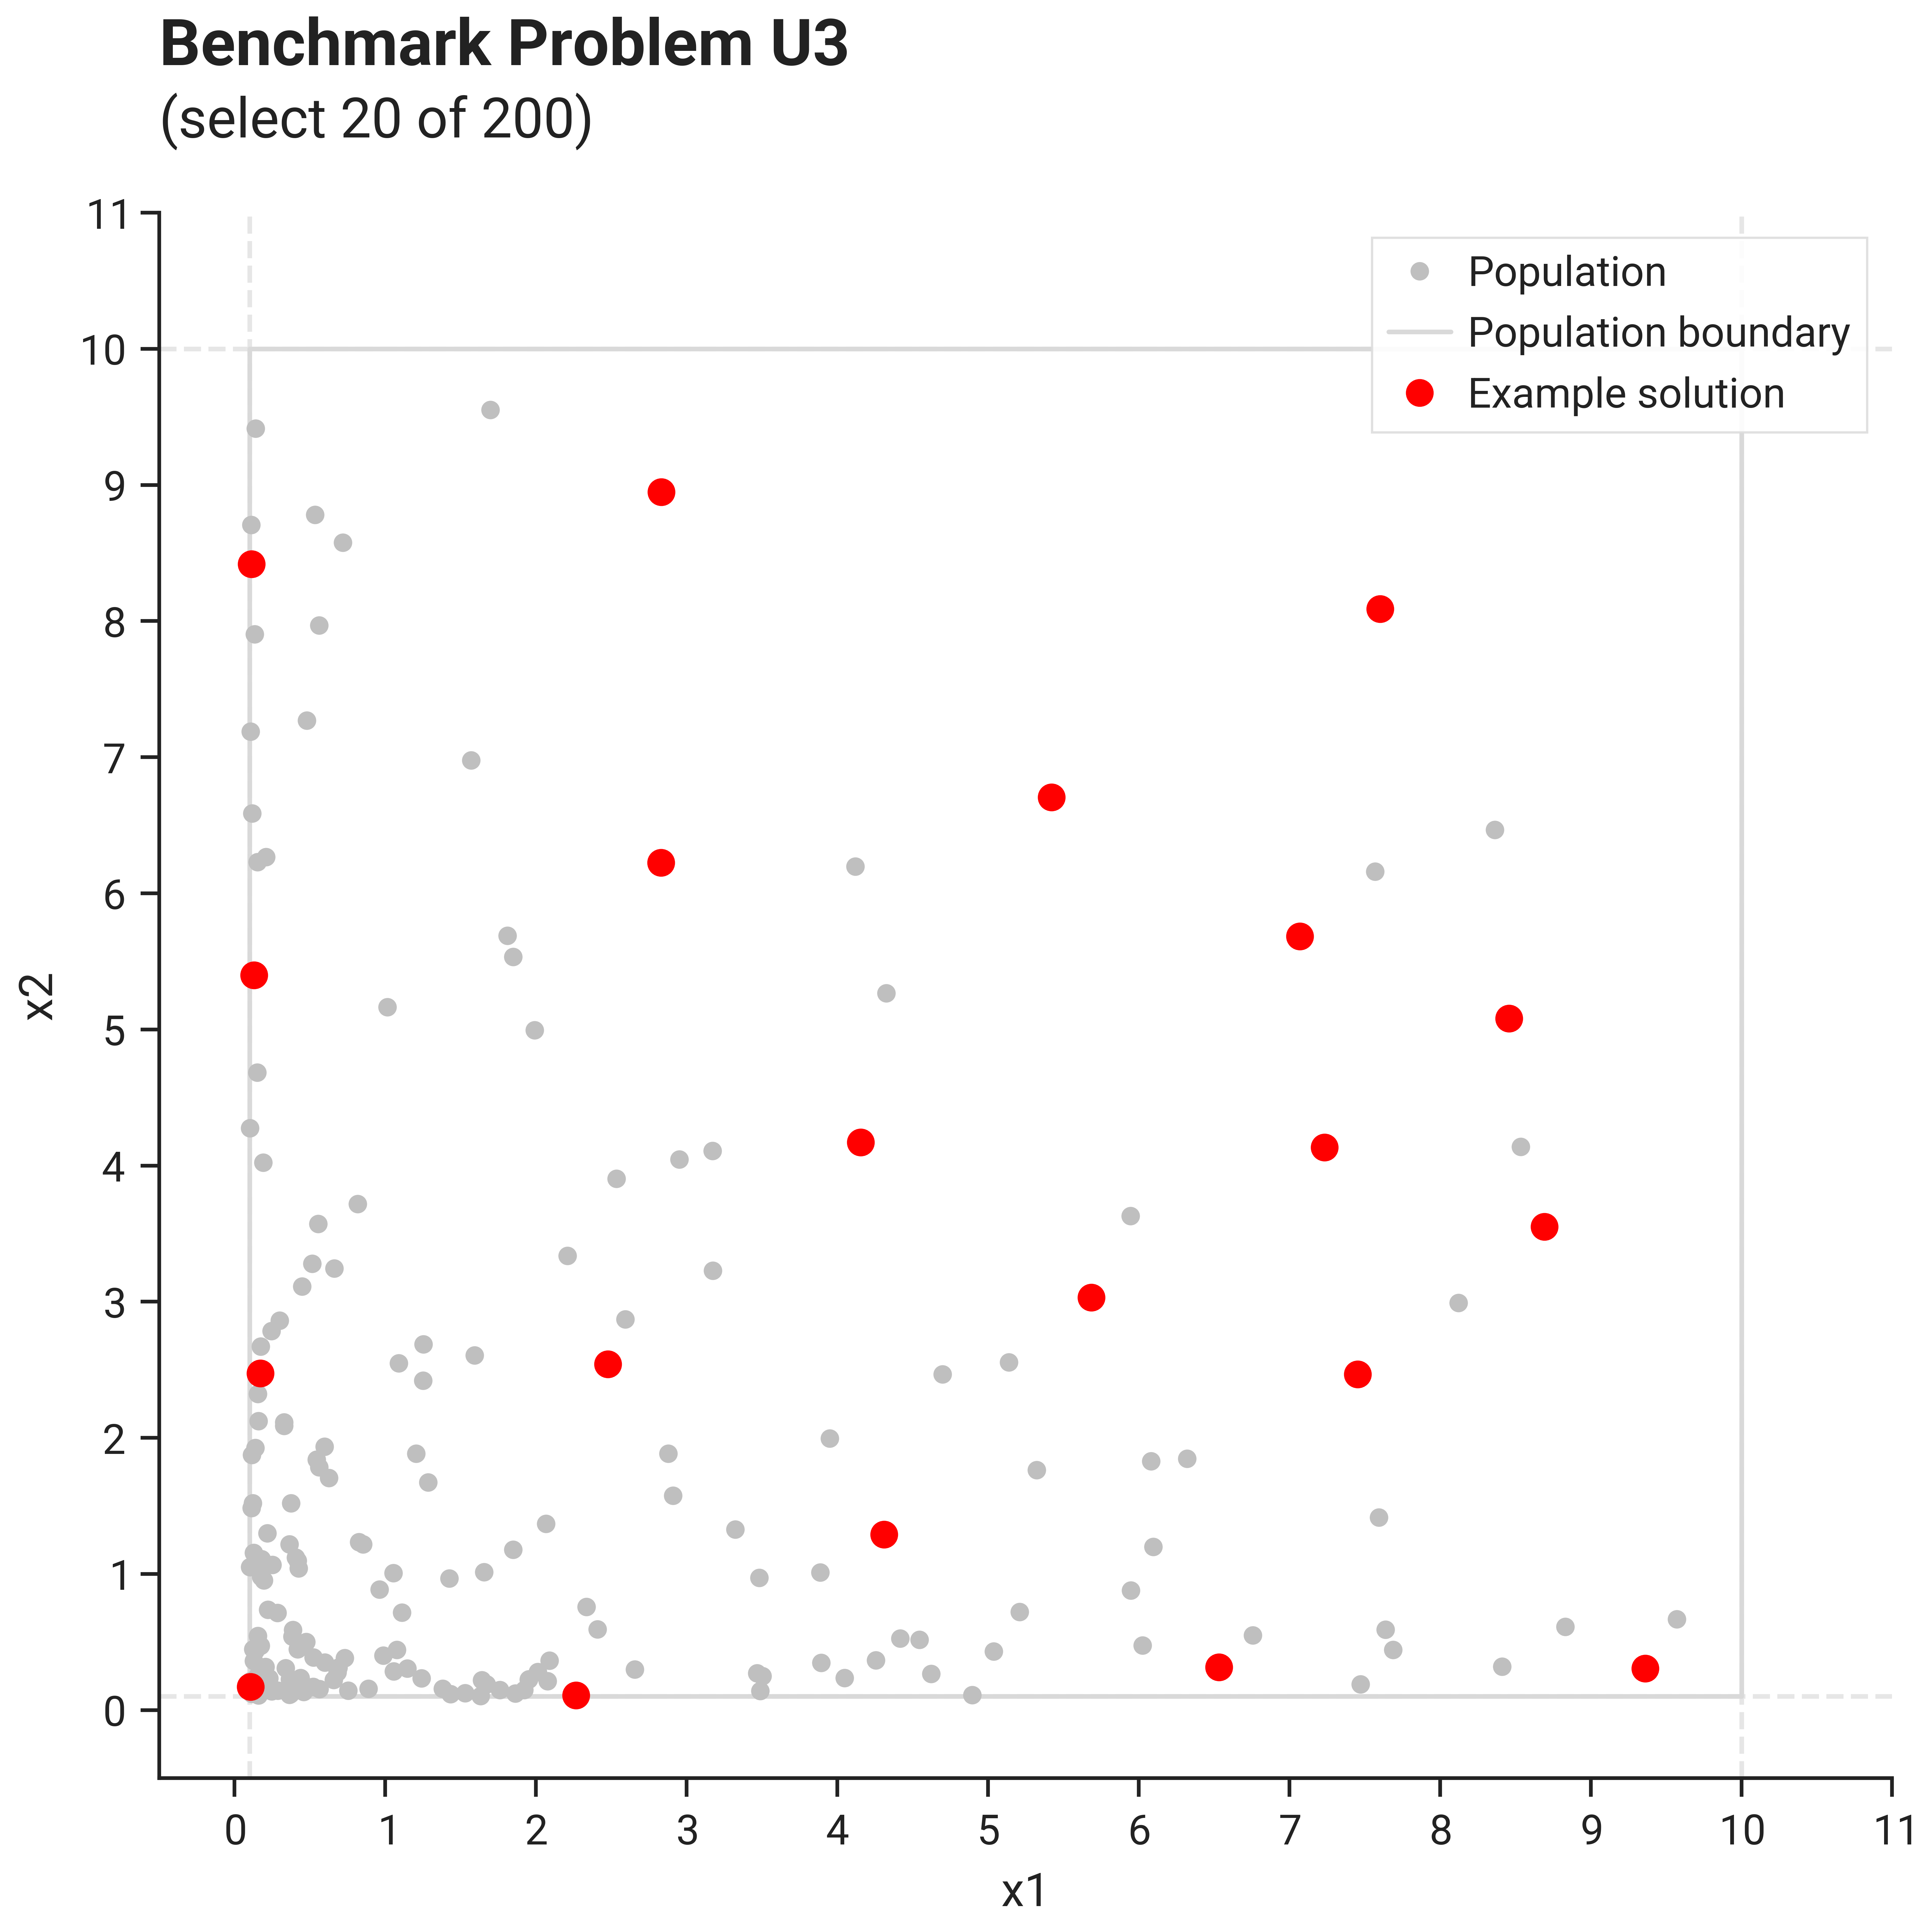
The image below shows an example solution, obtained by using the DEFAULT solver preset over 10.000 iterations
using the L2 distance metric and the geomean_separation diversity metric:
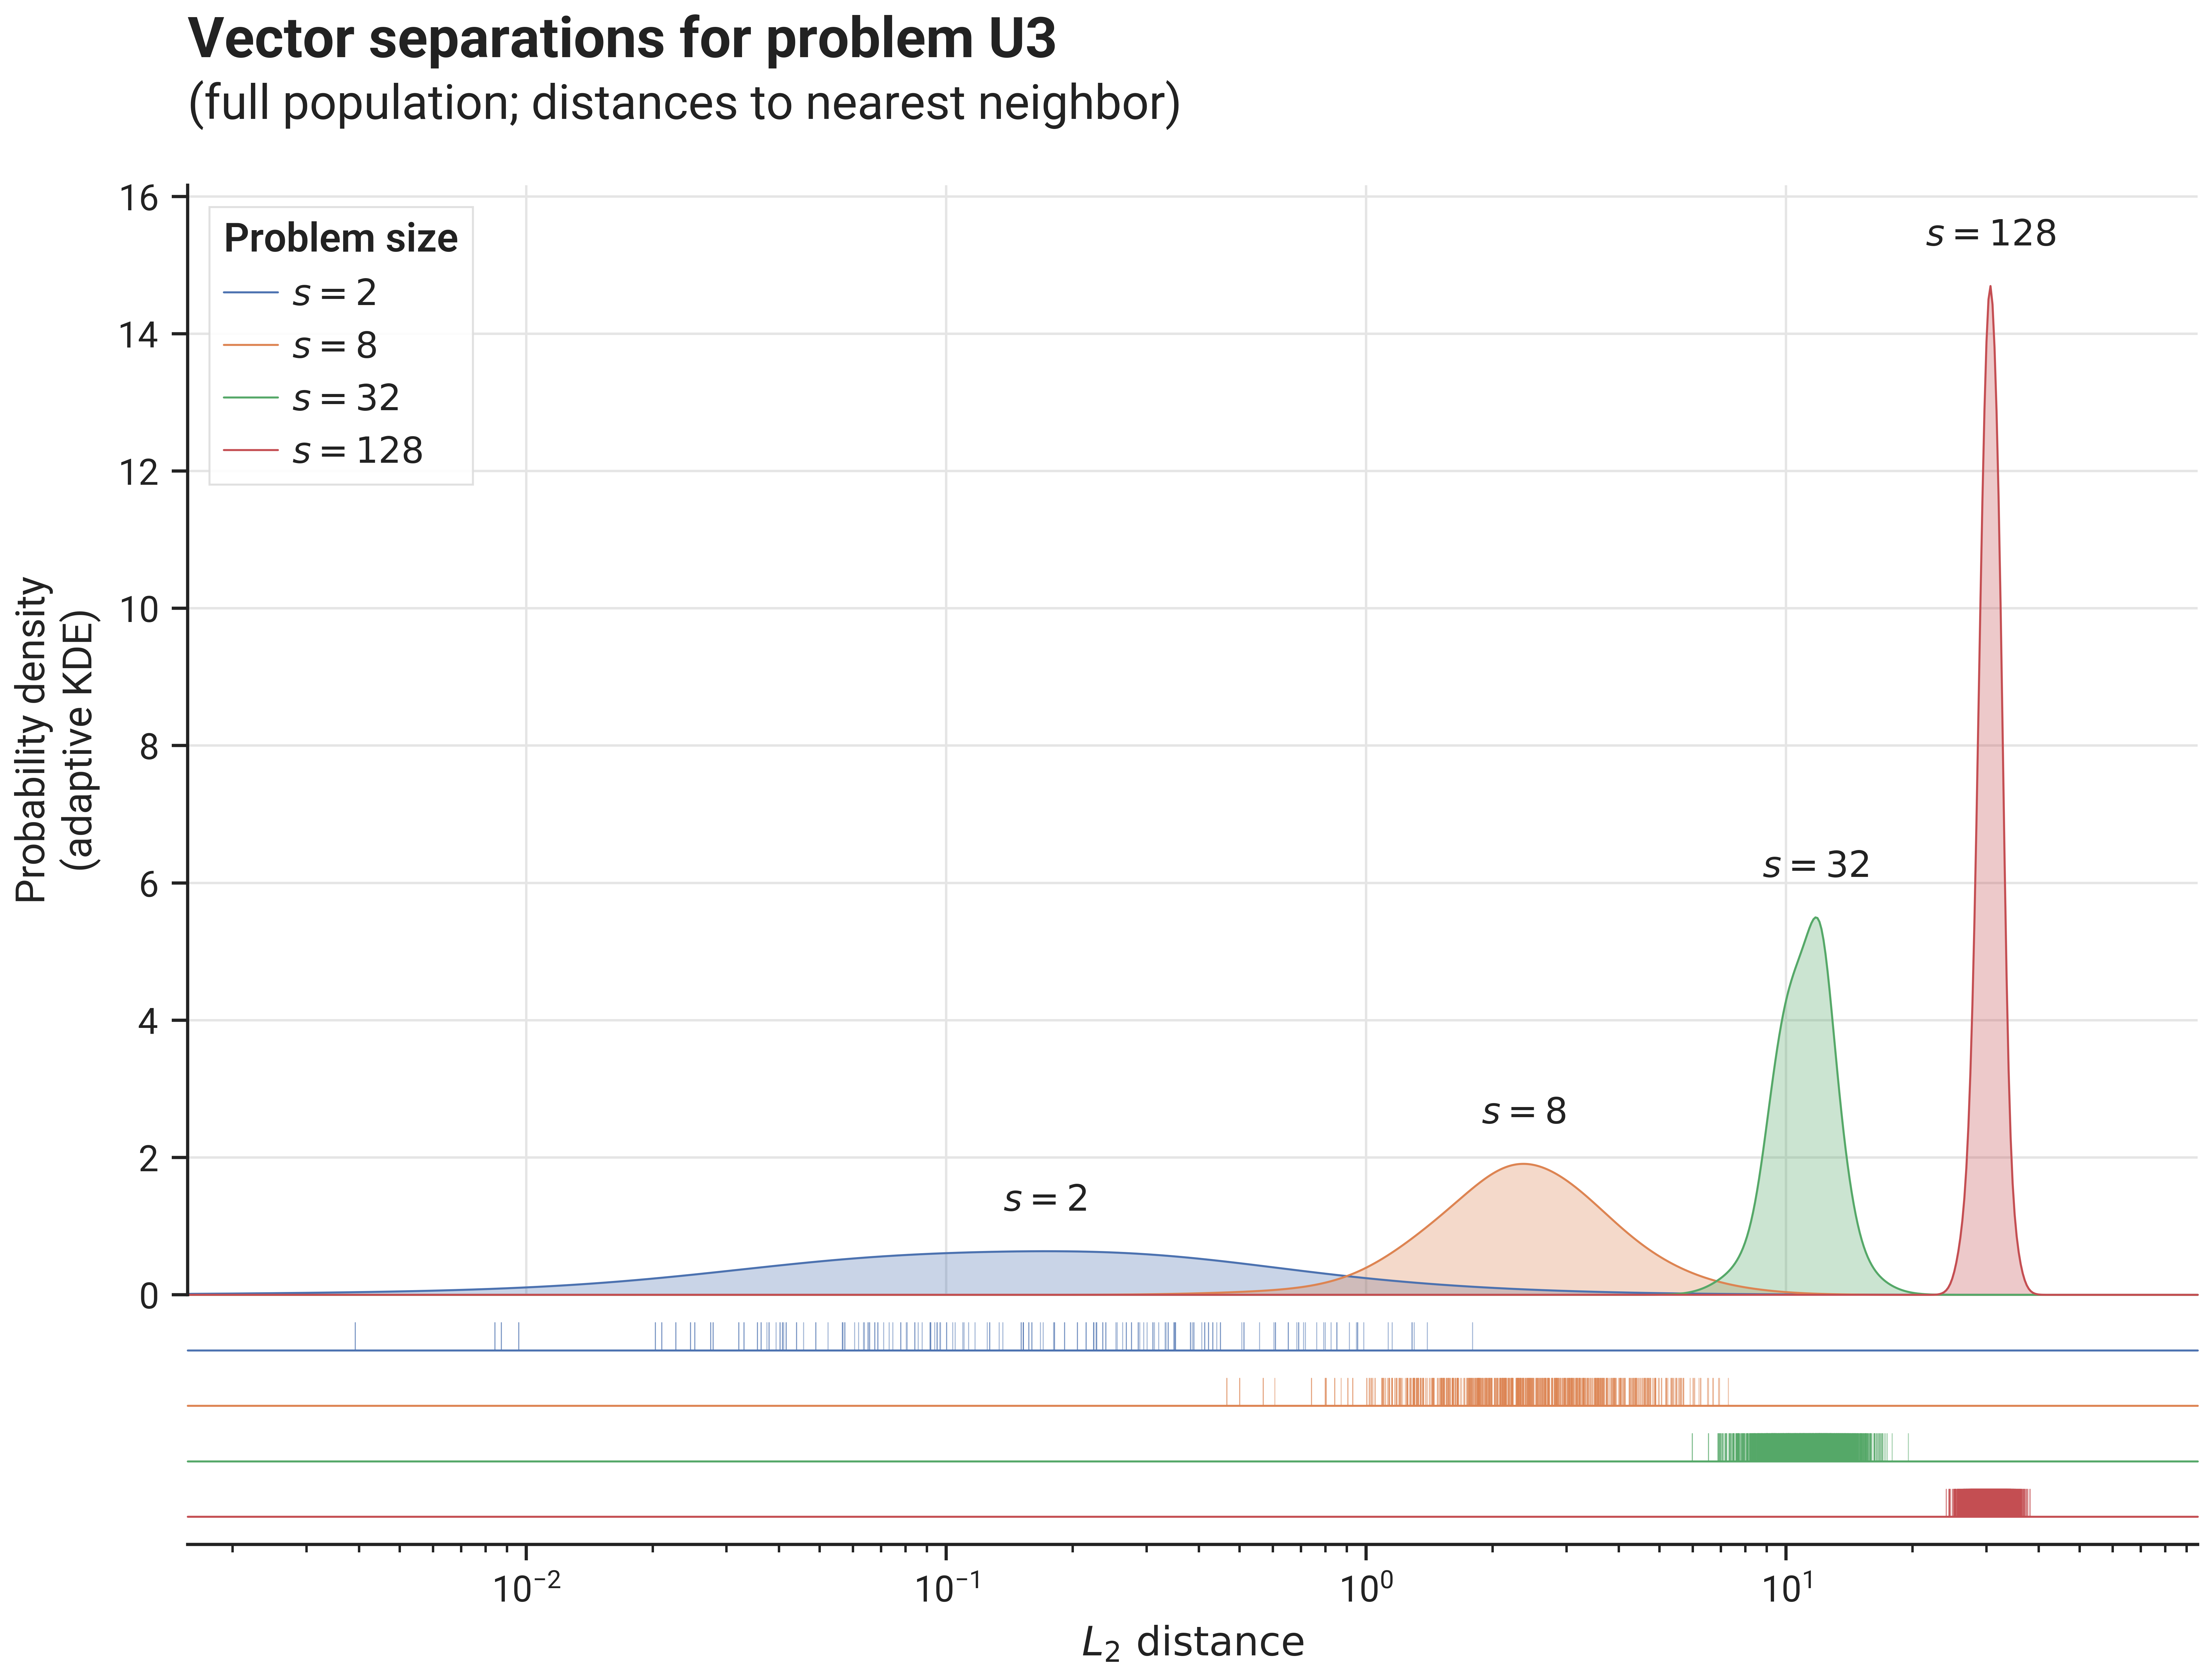
C. Separation statistics
The image below shows distribution of vector separations (distances to nearest neighbor for all vectors in the population), for different problem sizes: