Benchmark Results - Problem C4
I. Problem Description
A. Overall Approach
Vector components are drawn from a standard normal distribution \(\mathcal{N}(0.5, 1)\), i.e. centered around \(0.5\) and therefore...
- \(\sim 69\%\) of values are expected to be positive
- \(\sim 31\%\) of values are expected to be negative
- \(\sim 62\%\) of values are expected to be in the range \([-1, +1]\)
In each of the \(d=s\) dimensions, we define \(3\) groups, based on the value of that dimension's vector component:
- between \(\frac{4}{10}k\) and \(k\) vectors with positive component in that dimension need to be selected
- between \(\frac{4}{10}k\) and \(k\) vectors with negative component in that dimension need to be selected
- between \(\frac{7}{10}k\) and \(k\) vectors with component in the range \([-1, +1]\) in that dimension need to be selected
Note that in this example, we also have overlapping groups within a single dimension, as well as across dimensions, creating \(4^d\) possible combinations of group membership.
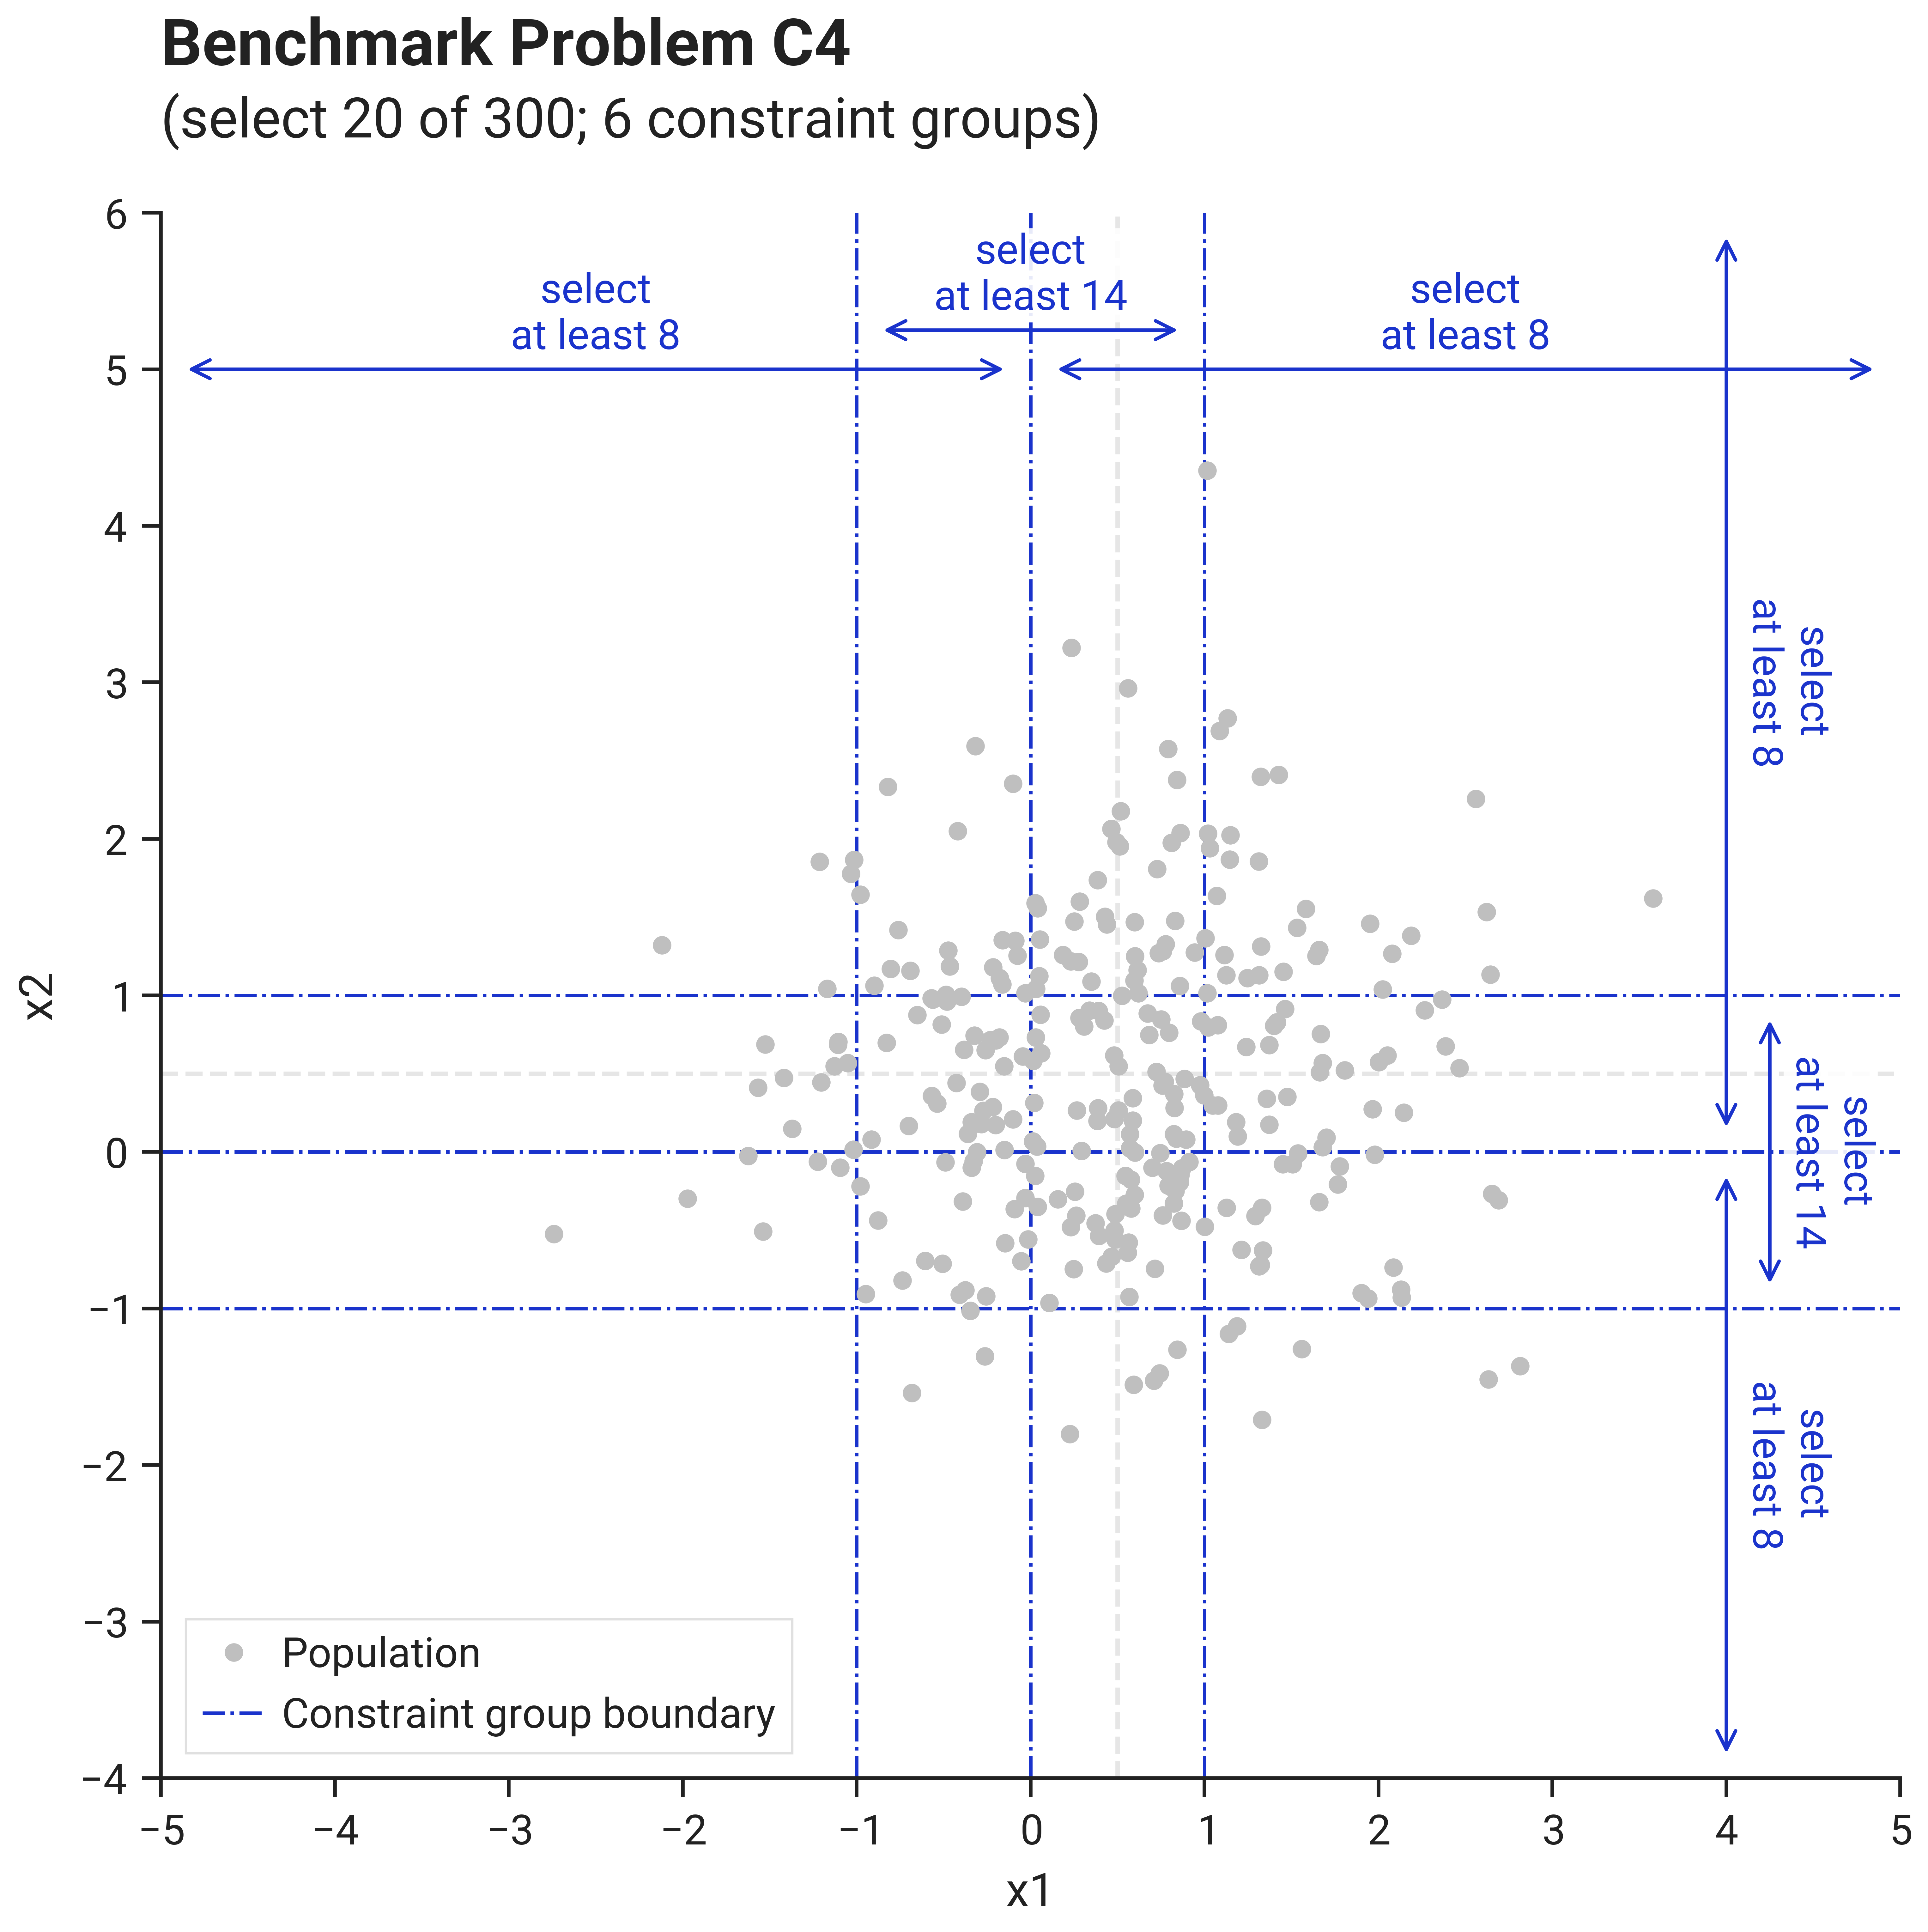
B. Visualization
This image shows problem C4 with size parameter \(s=2\) (thus \(d=2\), \(n=300\), \(k=20\), \(m=6\)):
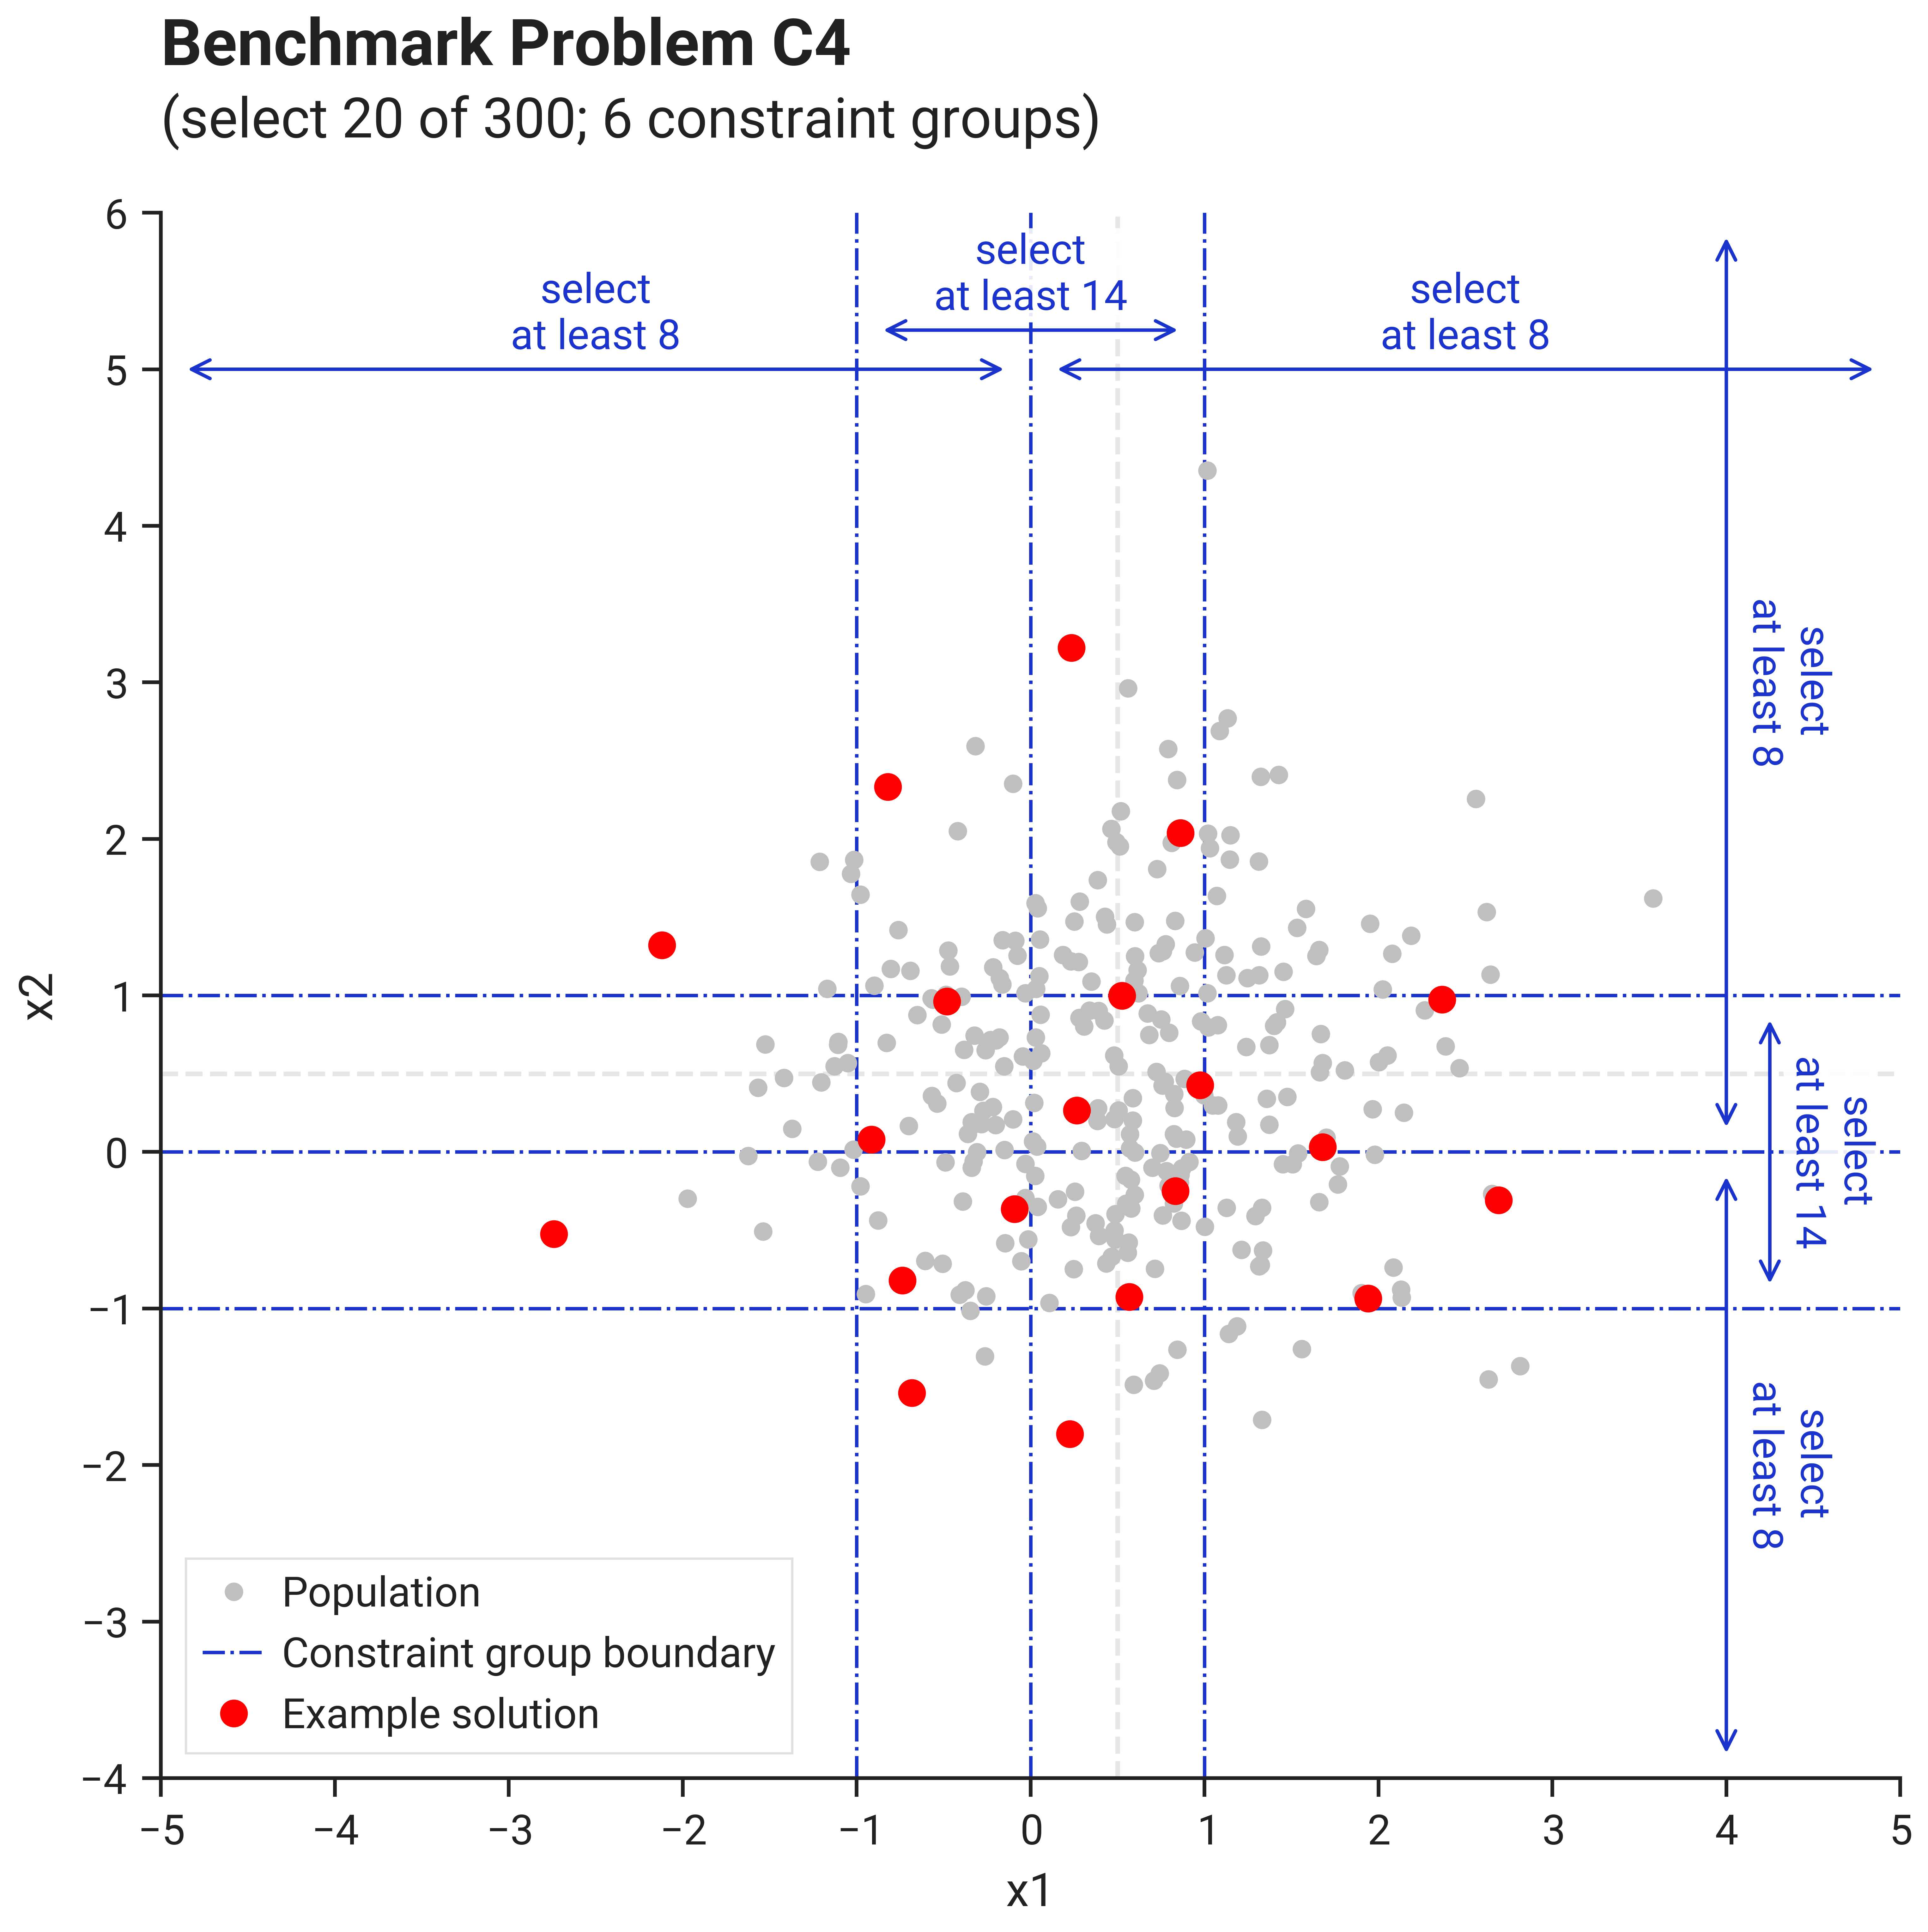
The image below shows an example solution, obtained by using the DEFAULT solver preset over 10.000 iterations
using the L2 distance metric and the geomean_separation diversity metric:
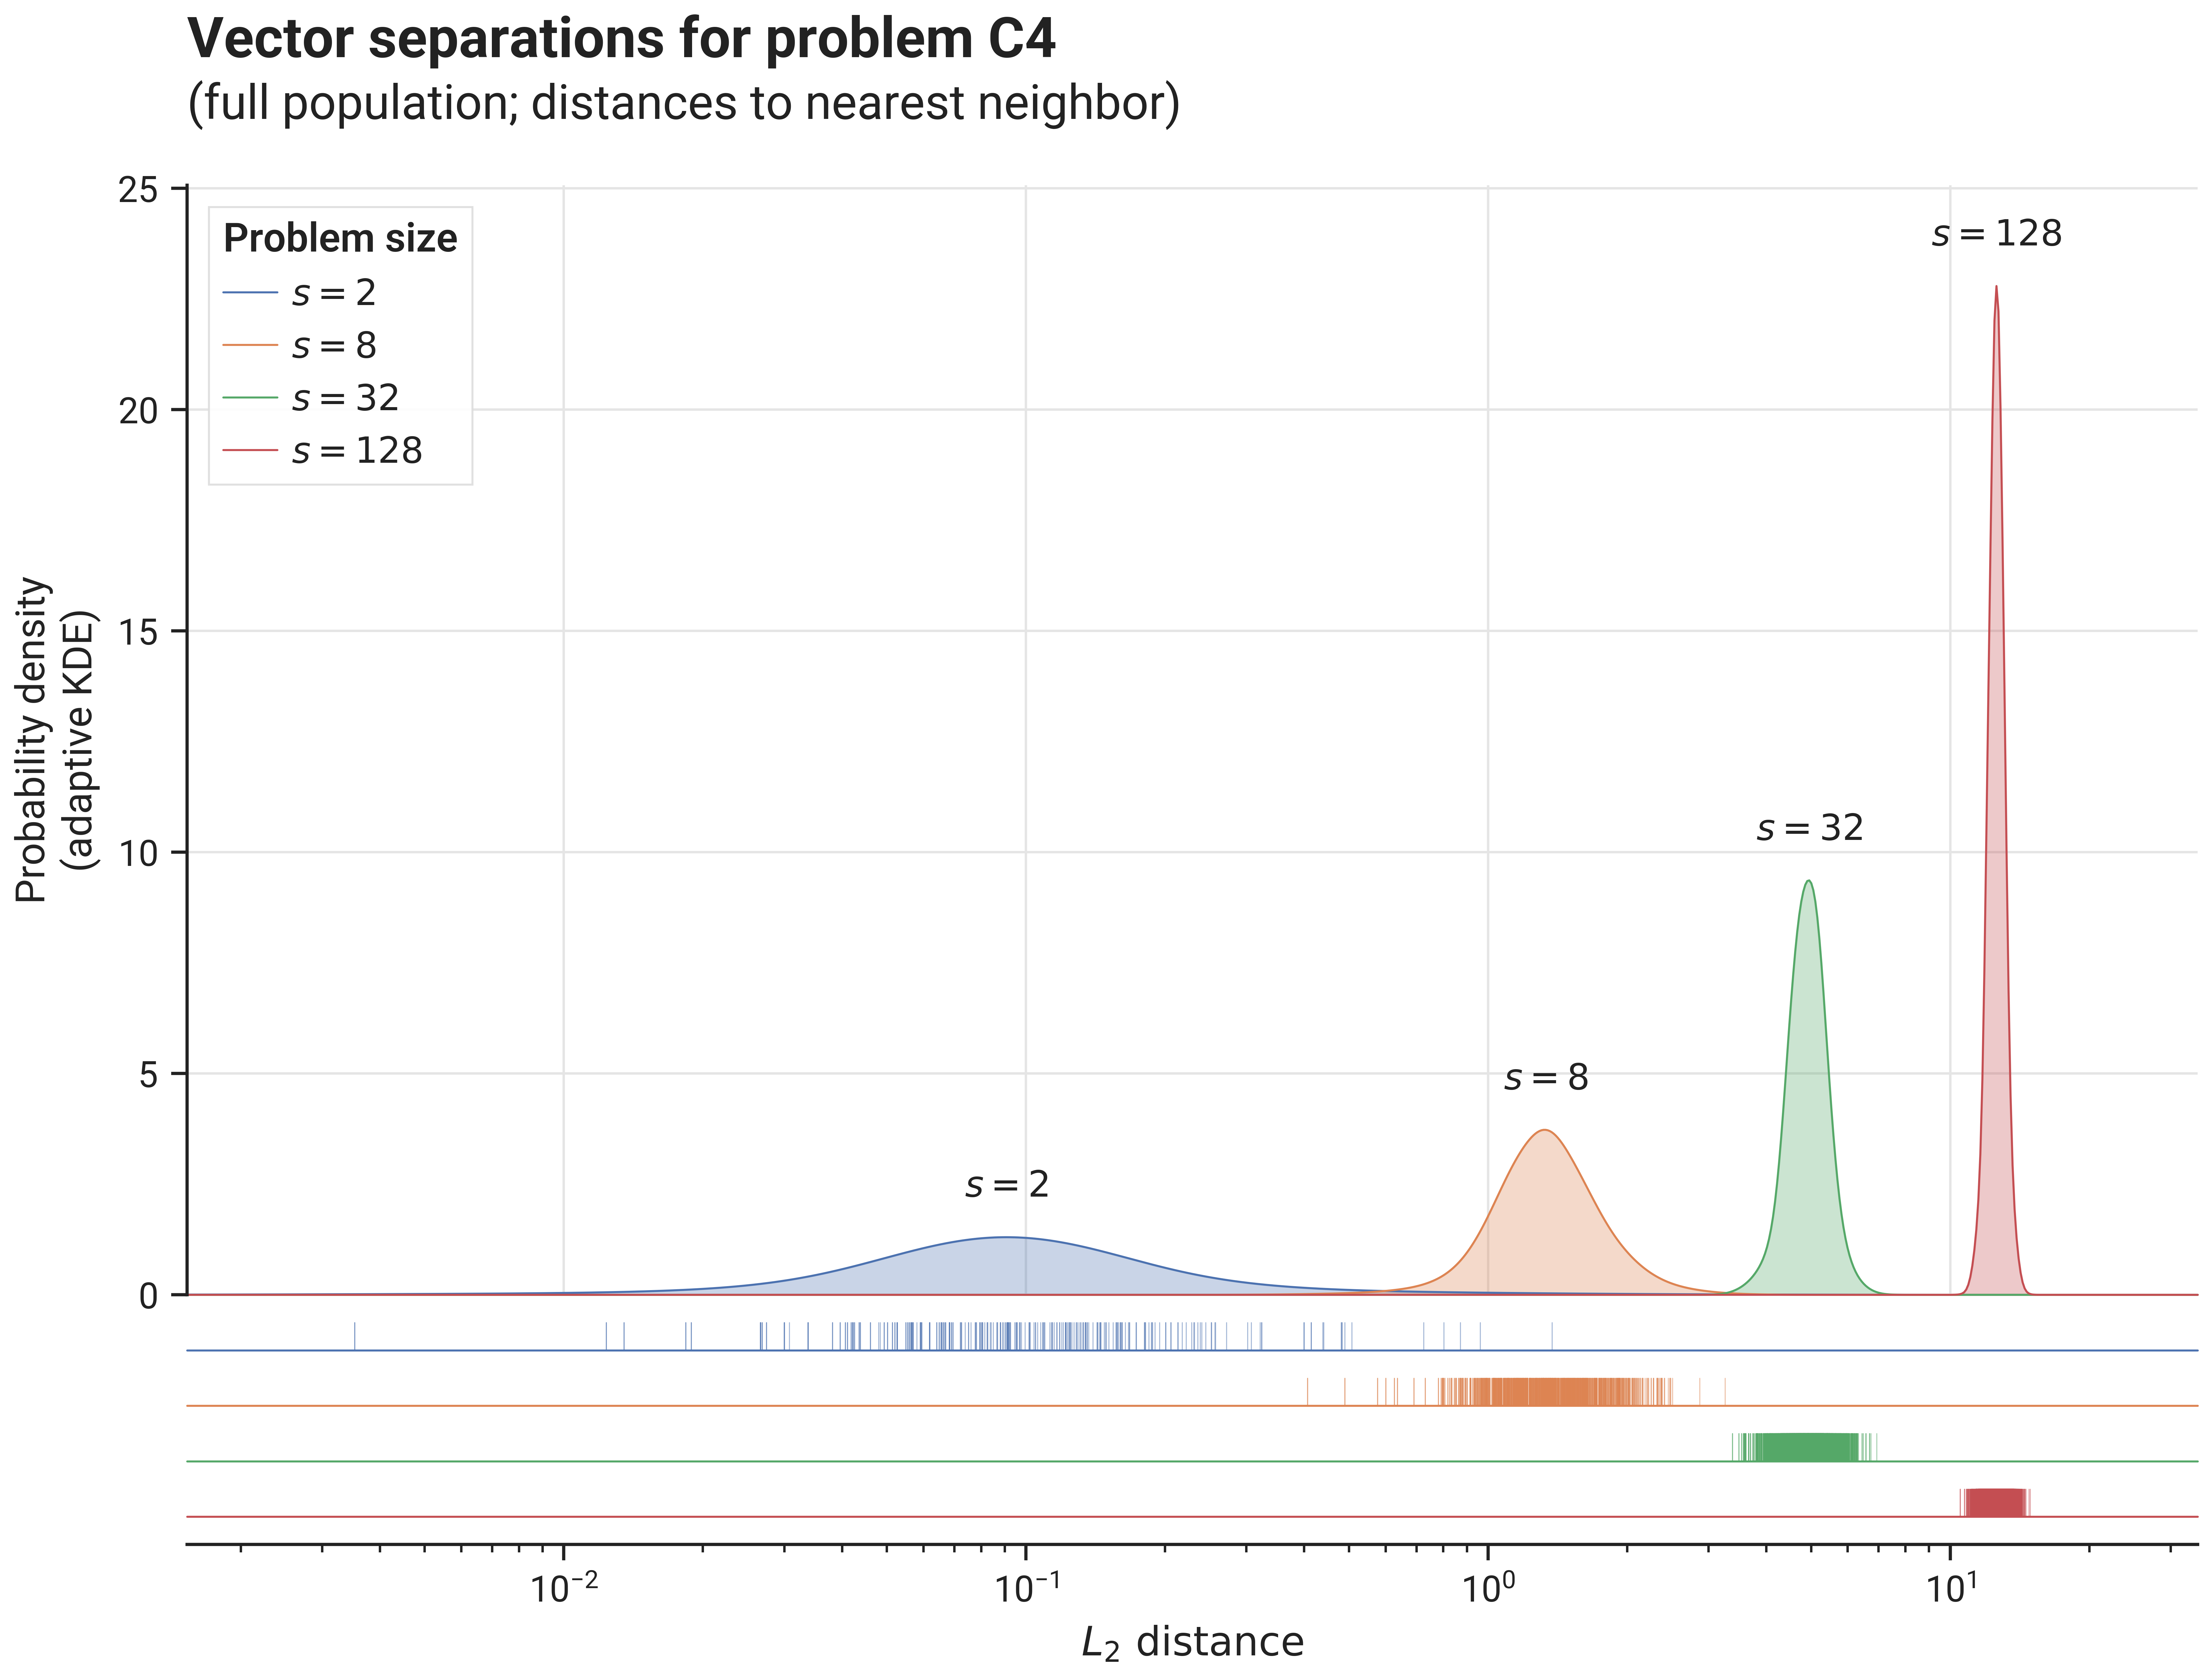
C. Separation statistics
The image below shows distribution of vector separations (distances to nearest neighbor for all vectors in the population), for different problem sizes: